In the intricate world of real estate and business asset valuation, data-driven decision-making separates successful investors from those who rely on guesswork. Whether you are a first-time homebuyer, a seasoned property developer, or a business analyst evaluating market trends, understanding market health is paramount. One of the most powerful, yet often overlooked, metrics in this domain is the sale-to-list ratio. How is sale to list ratio calculated is a question that forms the foundation of strategic pricing, negotiation power, and market timing. This ratio acts as a financial compass, guiding sellers to set realistic expectations and buyers to gauge competition before making an offer.
The sale-to-list ratio is essentially a mathematical representation of the final negotiated price compared to the initial asking price. In a fluctuating economy, this percentage reveals whether the market favors buyers or sellers. A ratio above 100% indicates a seller’s market where properties sell for more than the asking price, often due to bidding wars. Conversely, a ratio below 100% suggests a buyer’s market, where properties linger and final prices fall below the initial list. By mastering this calculation, stakeholders can avoid the pitfalls of emotional pricing and instead ground their strategies in hard data.
The Core Formula: Breaking Down the Calculation
To truly leverage this metric, one must first understand the mechanics behind it. The formula itself is remarkably simple, yet the insights it yields are profound.
The Mathematical Equation
The calculation is straightforward:
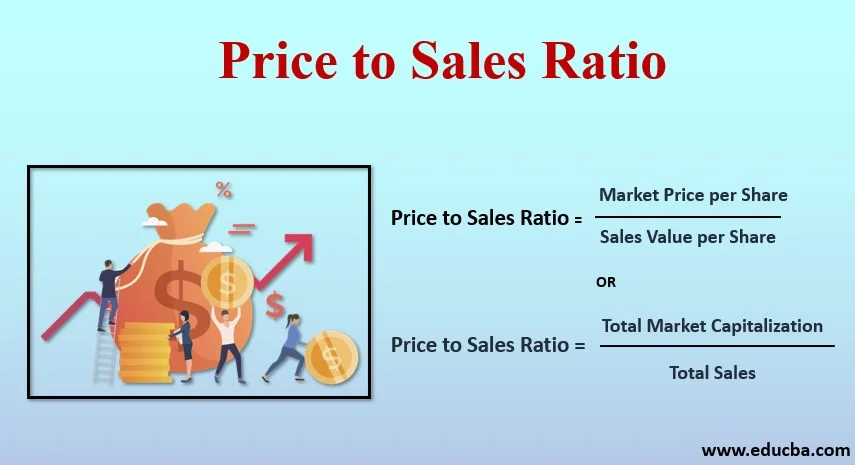
Sale-to-List Ratio = (Final Sale Price / Final List Price) x 100
For example, if a commercial property is listed at $500,000 and eventually sells for $490,000, the calculation would be:
490,000 / 500,000 = 0.98 x 100 = 98%.
This means the property sold for 98% of its asking price. Conversely, if a residential home listed at $300,000 sells for $310,000, the ratio is 103.3%, indicating significant competition.
The Importance of “Final” Prices
When discussing how is sale to list ratio calculated, it is crucial to note that the “list price” used in the equation should be the final listing price, not necessarily the original listing price. In real estate, sellers often reduce prices if a property sits on the market for too long. Using the original price would skew the data, making the ratio appear artificially low or high. Analysts typically use the price at the time of the accepted offer to ensure accuracy.
The Strategic Significance in Business and Real Estate
Understanding this ratio is not just an academic exercise; it is a practical tool for wealth management and business strategy. In the context of business acquisitions, this metric helps entrepreneurs value competitor assets or assess the liquidity of the market.
A Leading Indicator for Market Shifts
One of the primary reasons professionals track the sale-to-list ratio is its ability to signal market shifts before they become obvious. When the ratio consistently rises above 100%, it indicates a seller’s market. This is often driven by low inventory, high demand, or favorable economic conditions like low-interest rates. For business owners looking to sell their company’s physical assets or real estate holdings, a rising ratio suggests it is an opportune time to list, as buyers are willing to pay a premium.
Negotiation Power Indicator
For buyers and sellers engaged in negotiations, this metric serves as a negotiation power indicator. A high ratio (above 100%) gives sellers the upper hand; they can expect multiple offers and can push for terms favorable to them. A low ratio (below 95%) empowers buyers. They have the leverage to request concessions, such as repair credits, closing cost assistance, or price reductions. By calculating this ratio for comparable properties in the area, a buyer can determine whether offering below the asking price is a reasonable strategy or a waste of time.
Advanced Analysis: Segmenting the Data
To gain a competitive edge, it is essential to move beyond the city-wide average and analyze specific segments. Not all properties behave the same way under the same economic conditions.
Price Point Stratification
Luxury assets often have a different sale-to-list ratio than entry-level assets. In many markets, properties priced in the lower to mid-tier tend to have ratios closer to or exceeding 100% because they appeal to a larger pool of buyers. Conversely, high-end luxury properties often sell for a discount, resulting in ratios that hover around 85% to 95%. This is due to a smaller buyer pool and longer marketing times. When evaluating how is sale to list ratio calculated for a specific asset, comparing it against similar price points provides a more accurate benchmark than using a broad market average.
Geographic Micro-Markets
Real estate is inherently local. A city might have an average ratio of 98%, but specific neighborhoods could be experiencing ratios of 105% due to school district quality, new infrastructure projects, or job center proximity. Investors conducting real estate market analysis must drill down to the zip code level to avoid being misled by aggregate data. For instance, a business owner looking to lease or sell a commercial storefront in a revitalizing downtown area will likely encounter a significantly higher ratio than one located in a stagnant suburban strip mall.
How to Use the Ratio for Investment Decisions
Armed with the knowledge of how is sale to list ratio calculated, investors can implement specific strategies to maximize returns.
For Sellers: Pricing Strategy
Sellers often make the mistake of overpricing a property to “leave room for negotiation.” However, in a market where buyers are data-savvy, overpricing can be detrimental. If a property is listed above the market norm, it may experience a low sale-to-list ratio after price reductions, or worse, it may not sell at all. An optimal strategy is to price the property slightly below the market-clearing price to generate multiple offers, driving the ratio above 100%. This “price low to sell high” strategy relies on the psychological trigger of competition.
For Buyers: Identifying Value
For buyers, a low sale-to-list ratio can signal an opportunity to acquire an asset below intrinsic value. However, a low ratio does not always indicate a “deal.” It may indicate that the property has significant structural issues, poor location, or an unrealistic seller. Buyers should analyze the days on market (DOM) in conjunction with the ratio. A property with a DOM of 90 days and a ratio of 92% might be a candidate for a strong offer with contingencies, whereas a property with a ratio of 92% but only 5 DOM might simply have been mispriced initially.
The Interplay with Other Business Metrics
In the broader business landscape, the sale-to-list ratio intersects with other financial and operational metrics. For entrepreneurs, particularly those in the construction, retail, or investment sectors, understanding this interplay is vital for growth.
Inventory Management and Cash Flow
For businesses that hold real estate as part of their operations (such as hotels, warehouses, or retail outlets), the sale-to-list ratio influences capital expenditure decisions. If the ratio in a specific area is rising, it indicates asset appreciation. Business owners might choose to leverage this equity to secure better financing rates for expansion. Conversely, a declining ratio might signal a need to reduce overhead or divest underperforming assets to preserve cash flow.
Market Analysis for Expansion
When planning to open a new location, businesses must assess the property valuation metric of the area. A high sale-to-list ratio suggests a tight market with limited available properties. This could mean higher acquisition costs but also indicates high consumer demand in that location—a double-edged sword. On the other hand, an area with a very low ratio might offer cheap real estate, but it could also signal an economic downturn or lack of consumer traffic, which is detrimental to retail or service-based businesses.